Beyond Planning

Models built
on your data.

Forecasting, document reading and visual inspection, evaluated against a baseline before anything ships.
Neural network · training runTraining
Layers5
Epoch0
Loss0.512
Val error11.8%

Your history becomes the forecast.

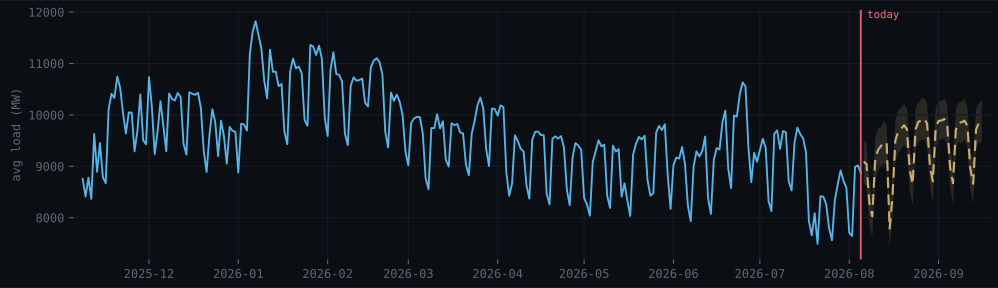
Demand, load, volumes or arrivals. A model is trained on your history and your calendar, and returns a forecast with a band around it, scored against your current method on weeks it never saw.
Grid load · BelgiumElia open data
History765 days
Horizon42 days
MAPE4.4%
Baseline6.1%
Nine months of daily Belgian grid load with a 42-day forecast and uncertainty band
12 GW11109JunJulAugnow
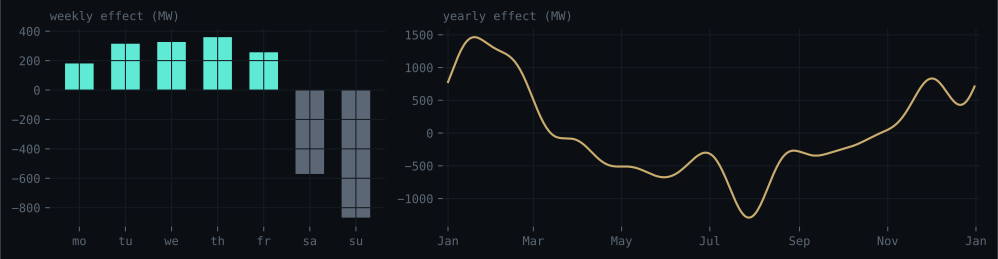
Learned components
Sunday−860 MW
Winter peak+1,450 MW
Learned weekly and yearly seasonality of Belgian grid load
weekly effect (MW)+4000−400−800motuwethfrsasuyearly effect (MW)+10000−1000+1,450 MWJanAprJulOctDec

Seasonality is learned, not assumed

The trend, the weekly and yearly cycles and the holidays are read out of your history, and the components can be read directly: what a Sunday does to load, what the July shutdown does to a month.

The trend, the weekly and yearly cycles and the holidays are read out of your history.

The band is part of the forecast

Every point comes with the range it should fall in, so stock and staffing can be planned on the low and high end, not only the average.

Your calendar is an input

Holidays, promotions, shutdowns and price changes enter the model as drivers, so their effect is part of the forecast.

Any grain, any horizon

Hourly to monthly, one series or thousands, per product, site or line, from the same pipeline.
Documents become structured records.

A model reads the documents your operation receives: scans, photos, mixed languages. It finds each field on the page and returns the record your systems need. Fields below the confidence threshold go to a person first.

Extraction · incoming invoicesLive
Queue41 docs
Straight through92%
To review1 field
Input · scanned PDFVD-2026-0834
VAN DAMME NVNijverheidslaan 12, 8500 KortrijkBTW BE 0451.223.664FACTUURNr. VD-2026-0834Datum 28.07.2026Vervaldag 27.08.2026OmschrijvingBedrag2.140,001.960,003.075,001.245,00Subtotaal€ 8.420,00BTW 21%€ 1.768,20Totaal€ 10.188,20IBAN BE68 5390 0754 7034 · BIC KREDBEBB
Output · recordkey fields
SupplierVan Damme NV0.99
Invoice date28 Jul 20260.98
Due date27 Aug 20260.71 · review
Total excl. VAT€8,420.000.97
VAT 21%€1,768.200.97
IBANBE68 5390 0754 70340.99
11 of 12 fields → ERP, automaticdue date → review queue

Your formats, your languages

The model is tuned on the documents you actually receive: scans, photos, mixed languages, supplier quirks.

A confidence per field

Each extracted field carries its own confidence, not one score for the whole document.

Review below the threshold

Fields under the threshold you set are routed to a person; the rest flow straight into your systems.

Corrections feed the model

Every manual correction is kept and becomes training data for the next round.

Camera feeds become structured output.

A vision model turns each frame into records your systems can act on. Seven tasks cover most industrial camera work, and every output carries a confidence with the review threshold you set.

A vision model turns each frame into records your systems can act on. Seven tasks cover most industrial camera work.

person 0.88pallet 0.96pallet 0.93forklift 0.91pallet 0.93forklift 0.91
014 objects · 31 fps

Object detection.

Every object in frame gets a class, a box and a confidence. Counting stock, finding vehicles at a gate, locating items on a belt.

parcel 0.97parcel 0.94parcel 0.91conveyor 0.98background 0.99parcel 0.97conveyor 0.98
023 masks · 24 fps

Instance segmentation.

Every pixel is classified, object or background, so each parcel keeps its exact outline. For work where shape and area matter: fill levels, damage surfaces, overlapping goods.

cracked0.97ok0.02chipped0.01stained0.00cracked0.97ok0.02chipped0.01stained0.00
034 classes

Classification.

The frame as a whole gets one label from a set you define. Passing or rejecting units on a line, grading produce, routing variants.

person 0.97back 48°knee 93°person 0.97back 48°knee 93°
041 person · 30 fps

Pose estimation.

Every person gets a skeleton of keypoints per frame, and the joint angles that follow from it. Lifting posture, reach studies, machine-cell safety.

05179 objects · aerial

Oriented boxes.

Boxes rotate with the object they enclose. For overhead and aerial views: trailers in a yard, containers, parts at an angle.

id 3 · forkliftid 4 · forkliftid 9 · personid 3 · forkliftid 4 · forkliftid 9 · person
063 tracks

Tracking.

Detections keep a stable identity from frame to frame, and every identity leaves a path. Counting in and out, dwell times, flow through a site.

12345678910111213pallet · 13
0713 objects · yard

Object counting.

Detections become totals per class and per region. Cycle counts in the yard, units per shift on a line, occupancy per zone.

Models are watched after they ship.

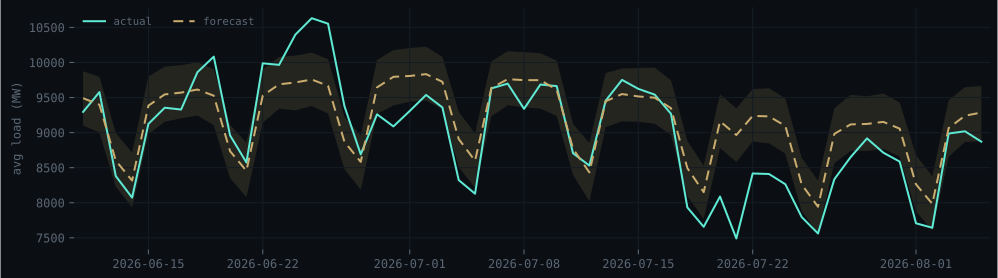
A model in production is compared against what actually happened. Error is tracked per series, and when it drifts toward the bound the model is retrained on the newer data.

A model in production is compared against what actually happened.

Forecast vs actual · grid loadHealthy
Window8 weeks
MAPE4.37%
Baseline6.11%
Eight held-out weeks of Belgian grid load: actual against the forecast and its band
12 GW111098 Jun15 Jun22 Junactualforecast

Scored once actuals arrive

Every prediction is compared to the real outcome as soon as it is known, automatically.

Drift has a bound

You set the error bound. When the rolling error approaches it, retraining is triggered and you are notified.

Versions stay deployable

Each retrain is a new version next to the old one. A retrain that underperforms is rolled back.

Inputs are watched too

A feed that changes shape or goes stale raises a flag before it reaches the forecast.